
Home › Technologies › CostCtrl
Technology · Cost and profitability

Profitability you can prove, not guess
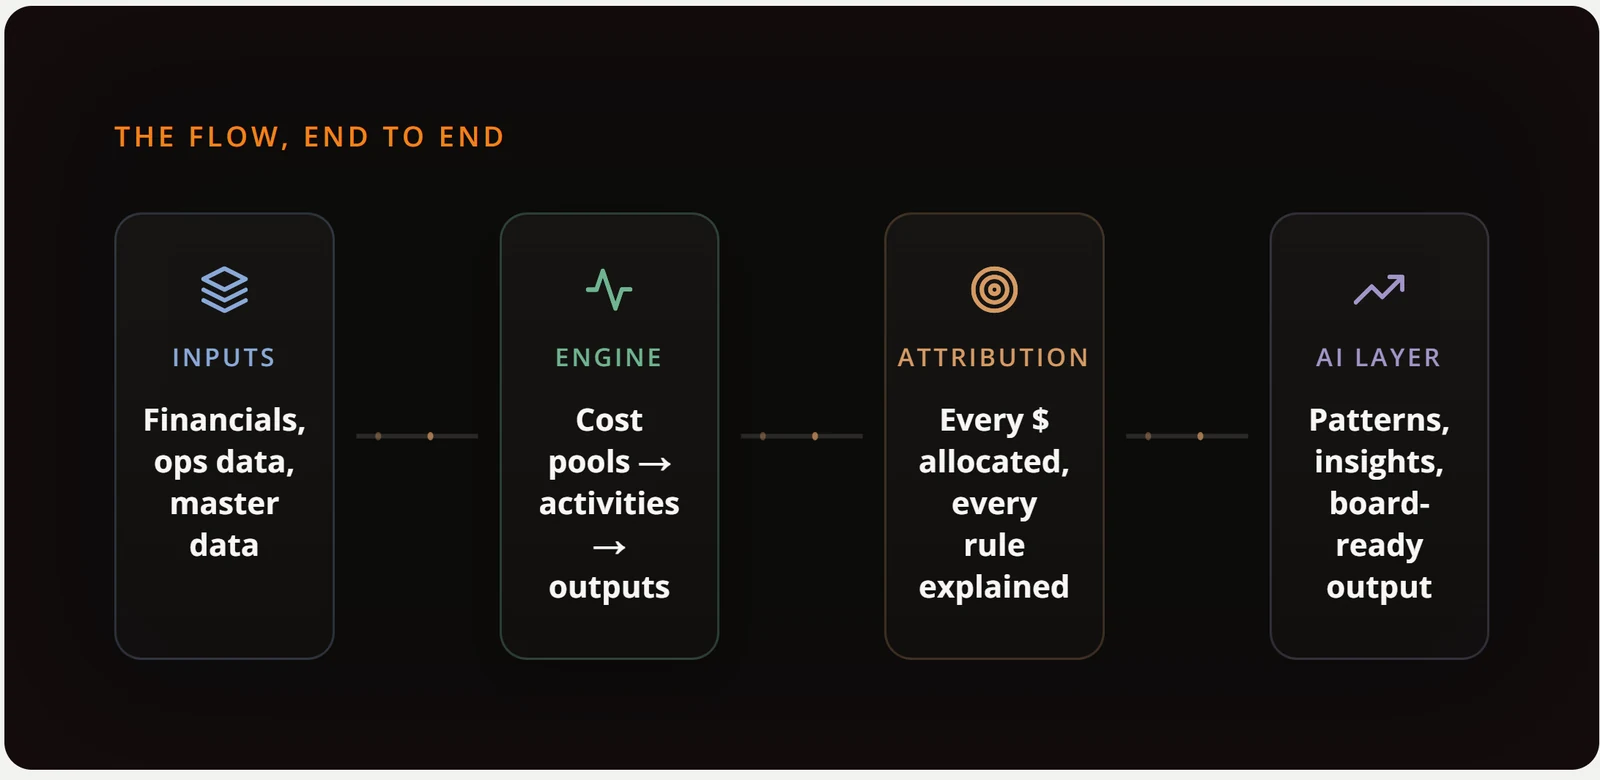
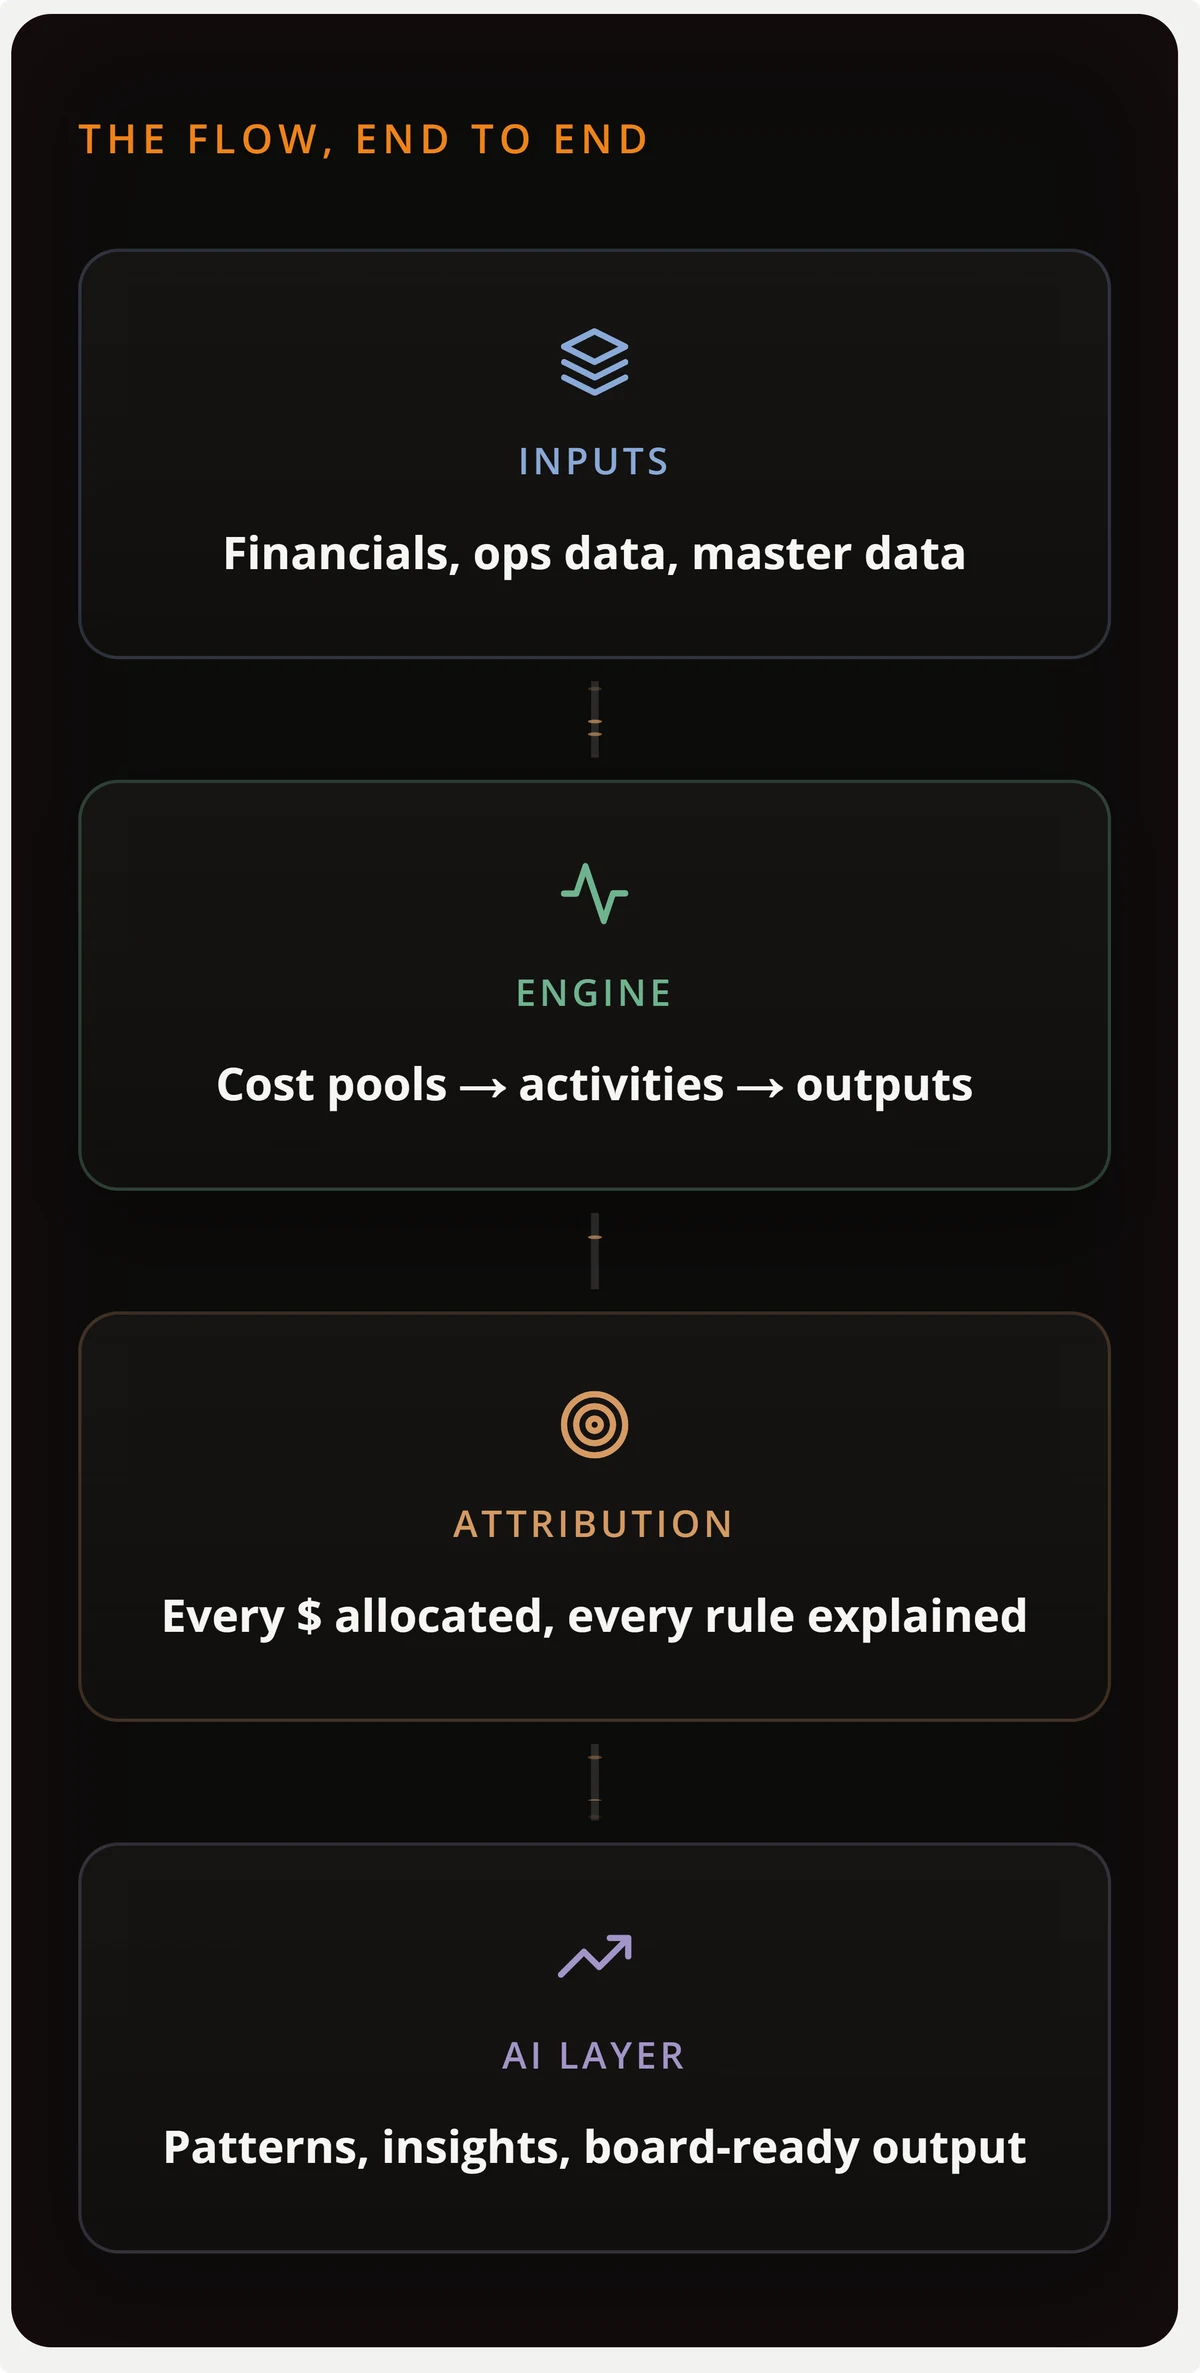
CostCtrl calculates the real cost of each activity, product, client and channel with activity-based costing (ABC and TDABC). Its engine is deterministic: every figure traces back to the rule and the data that produced it.
Where you make money and where you lose it
Not all your clients make you money
In almost every company, a minority of clients and products generates most of the profit, and another part destroys it without anyone noticing: the cost of serving them stays hidden in overhead.
The Pareto principle
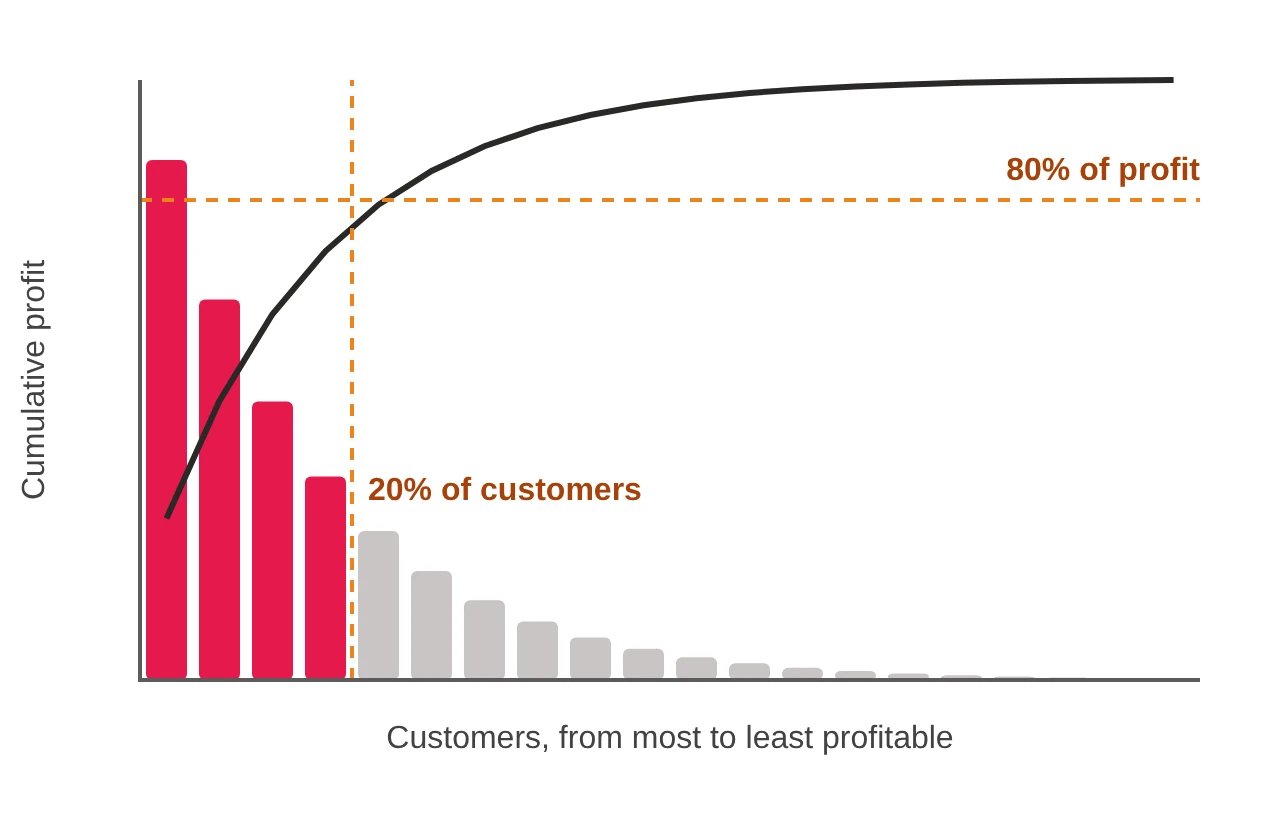
The typical pattern: 20% of clients or products generate 80% of profit, 70% barely cover their costs and 10% lose money.
The whale curve
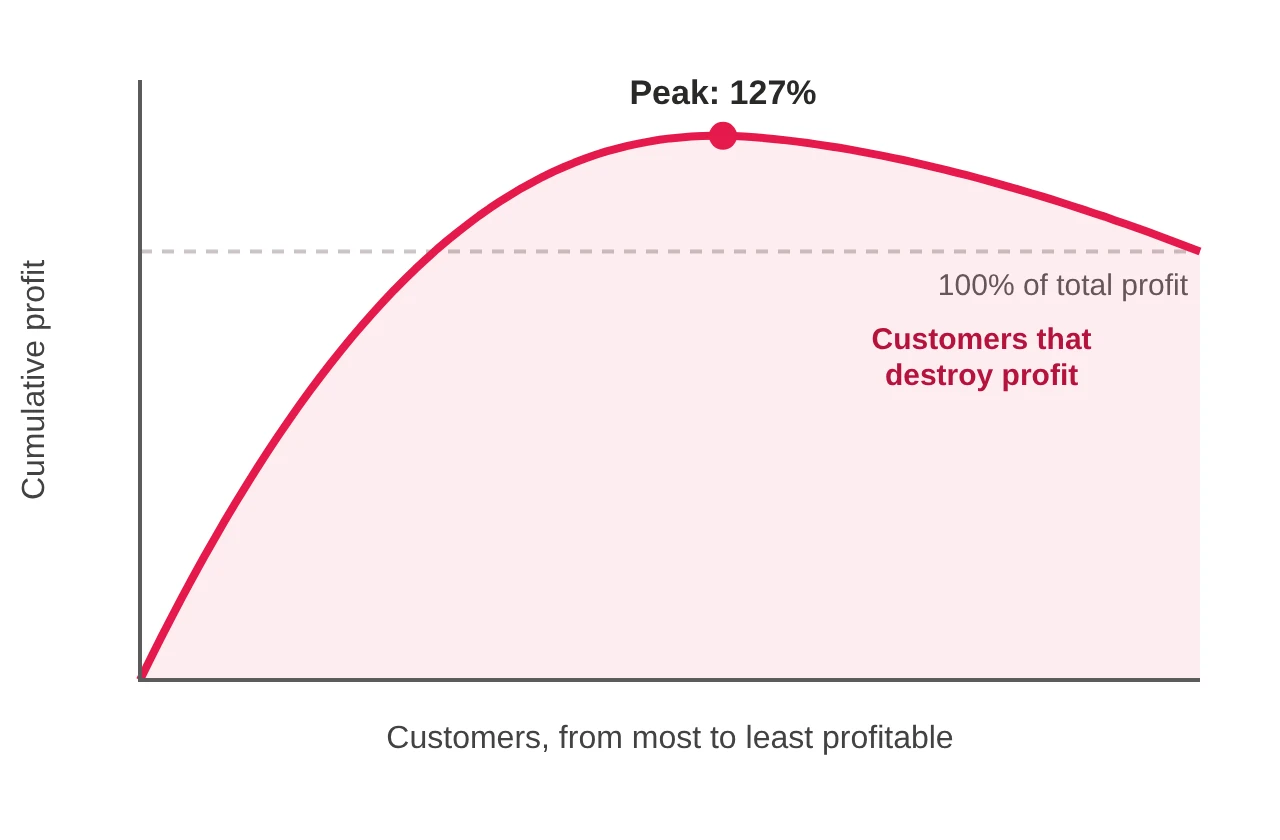
Rank your clients from most to least profitable and add up the profit: the curve rises above 100%, to 127% in CostCtrl's example, and then falls. That drop is what the clients who consume more than they bring in really cost.
Typical patterns published by CostCtrl. The charts are illustrative.
Attribution
Every dollar of cost, down to the client who consumed it
This view doesn't have to be a static month-end snapshot: it can be live, updated with your data, and AI can analyze it on the spot so you can decide quickly.

Illustrative example from CostCtrl, with fictitious data.
What CostCtrl does
A living cost model, not an annual spreadsheet
Deterministic engine with ABC and TDABC
Every figure traces back to the rule and the data that produced it. Nothing is a black box.
Scenarios before you decide
Copy a scenario, change prices, mix or operations and compare the results before acting.
AI that explains, not invents
The AI layer explains the results in plain language. Your own AI can create scenarios through a secure connection, but every figure comes from the engine.
Start with what you already have
There's no need to connect the ERP: most projects start with monthly exports. The automatic connection comes later, if it makes sense.
Reports included: whale curves, tree maps, profitability by client and by product line, and cost by activity, exportable to PDF, Excel and image.
Case published by CostCtrl
Snell: USD 670K recovered by no longer subsidizing clients
Distributor of industrial packaging, safety products and consumables in New Zealand, with 115 employees and thousands of business clients.
830 de 1.951
clients reduced profit once their real costs were attributed: −USD 1.34 million in total.
USD 670K
recovered: the negative contribution was cut in half.
−64%
loss-making clients: from 830 to 295, most of them now close to break-even.
How they did it: they repriced the client-product combinations that were losing money, focused on the products with buying power and the industries with sustainable margins, consolidated small orders and became their clients' consolidated supplier.
“CostCtrl gave us a view of our business we had never had.”
Scott Norton, Business Information Manager, Snell
Source: CostCtrl website (costctrl.com). The figures are CostCtrl's, not EXYGE's.
From our experience
Activity-based cost models since 1995
At EXYGE we have experience with activity-based models since 1995. Our team has built activity-based costing (ABC) and activity-based management (ABM) models in banking, hospitals and shared services centers, where the cost of each service underpins the service level agreements. CostCtrl lets us bring that method to a platform your team keeps alive.
Works alongside
mindzie, to measure the real time of each activity from your systems' records.
Xtract, to automate what the model shows costs too much.
Clairvoyance, for a financial planning analyst supported by AI agents working on the model.
What do we use it for at EXYGE?
The questions it answers
Which products, clients or channels are profitable, and which are we subsidizing without knowing it?
What does each back-office activity and process really cost?
What happens to the margin if we change prices, mix or the way we operate?
How do we keep the cost model up to date without rebuilding it every year in Excel?
How do we implement it?
From the model to the decision
Typical duration for mid-sized projects: first results in 3 to 6 weeks. The duration of each project is quoted according to its scope and may vary.
01
We design the model
Activities, cost drivers and cost objects, with ABC or TDABC depending on your reality.
02
We connect the data
We start with monthly exports from the ERP and the sources that already exist; the automatic connection comes later, if it makes sense.
03
We validate with your team
Each result is explained and traced to its source; nothing is a black box.
04
We decide with scenarios
We copy scenarios, change assumptions and compare results before acting.
In which solutions?
Where does CostCtrl come in?
Cost and profitability
The cost model by activity, product, client and channel, with scenarios to decide on prices and mix.
Finance operations and shared services
The cost of each internal service, to charge for it correctly and negotiate service level agreements with numbers.
Capacity and workloads
From measured time to TDABC cost drivers: what the capacity you use, and the capacity left over, really costs.
Do you know where you make money and where you lose it?
Let's talk for 30 minutes about your cost model.

